The Forecast Is Not An AI Problem
November 10th, 2026 | by Lane Nelson
Part 9 of 10 – where AI does not belong
Where not to use AI, and the older, duller tool that beats it.
It is 4:15 on a Thursday, and the slide on the screen says the number is 94%.
The vendor has been good all afternoon. The deck is clean, the case studies are plausible, and the phrase "AI-powered demand forecasting" has appeared, by Ellen's private count, eleven times. The 94% is a forecast-accuracy figure from another client, in another industry, and it is doing a great deal of work in the room. Two of Spiese Fluid Power's leadership team are nodding. Somebody asks what it would cost. The answer has a comma in it and a recurring monthly line underneath.
Ellen, who has been controller here for fourteen years, is not doing the math on the price. She is doing a different math – what fraction of this company's revenue is even forecastable – and the answer she keeps landing on is: not much of it. She has seen this movie. The demo is impressive. The problem is real. And the tool is aimed at the wrong 80% of the business.
This is the post where the honest answer is don't buy it – or at least, don't buy it here. Not because AI is bad, but because some problems are the wrong shape for it, and demand forecasting at a build-to-order shop is close to the purest example we have in this series. The right tool is older, duller, and already sitting in a spreadsheet down the hall.
What it costs today
Here is where this post breaks the pattern the earlier ones set. Post 2 could measure keying time and multiply. This one can't give you a clean savings table, because the cost being discussed is not a cost you are carrying – it is a cost you are about to take on. The number that matters is the price of the wrong project.
So size it the honest way, as three separate bills.
The sticker. A demand-forecasting platform with "AI" on the label carries a license, an implementation, and a data-integration effort – the six- and seven-figure ranges vendors quote are illustrative; get your own quote and your own internal-hours estimate before you believe any of them. Whatever the figure, it is real money, and it is money with an opportunity cost: every dollar here is a dollar not spent on the messy-language problems in the other nine posts, where the same budget actually earns.
The credibility. This is the one that lingers. A forecasting tool that underperforms the reorder points you already had – and against lumpy demand, it very often will – does not fail quietly. It fails in front of the people who approved it. The next AI proposal, including the good one, walks into a room that has learned the word "AI" means "the thing that cost us money and didn't work." (This is the local, human version of the industry pattern from Post 1 – Gartner's projection that more than 40% of agentic-AI projects will be cancelled by the end of 2027. Cancellations like this one are how that statistic gets made: not a failure of the technology, a failure to match the tool to the task.)
The distraction. While the forecasting project consumes attention, the boring reorder-point review that would genuinely help the parts catalog doesn't get done – because it isn't exciting and nobody is selling it.
Add those up and the "cost today" is a good team spending a year and a budget to end up slightly worse than a spreadsheet. That is the table this post refuses to fake.
Where the boundary sits
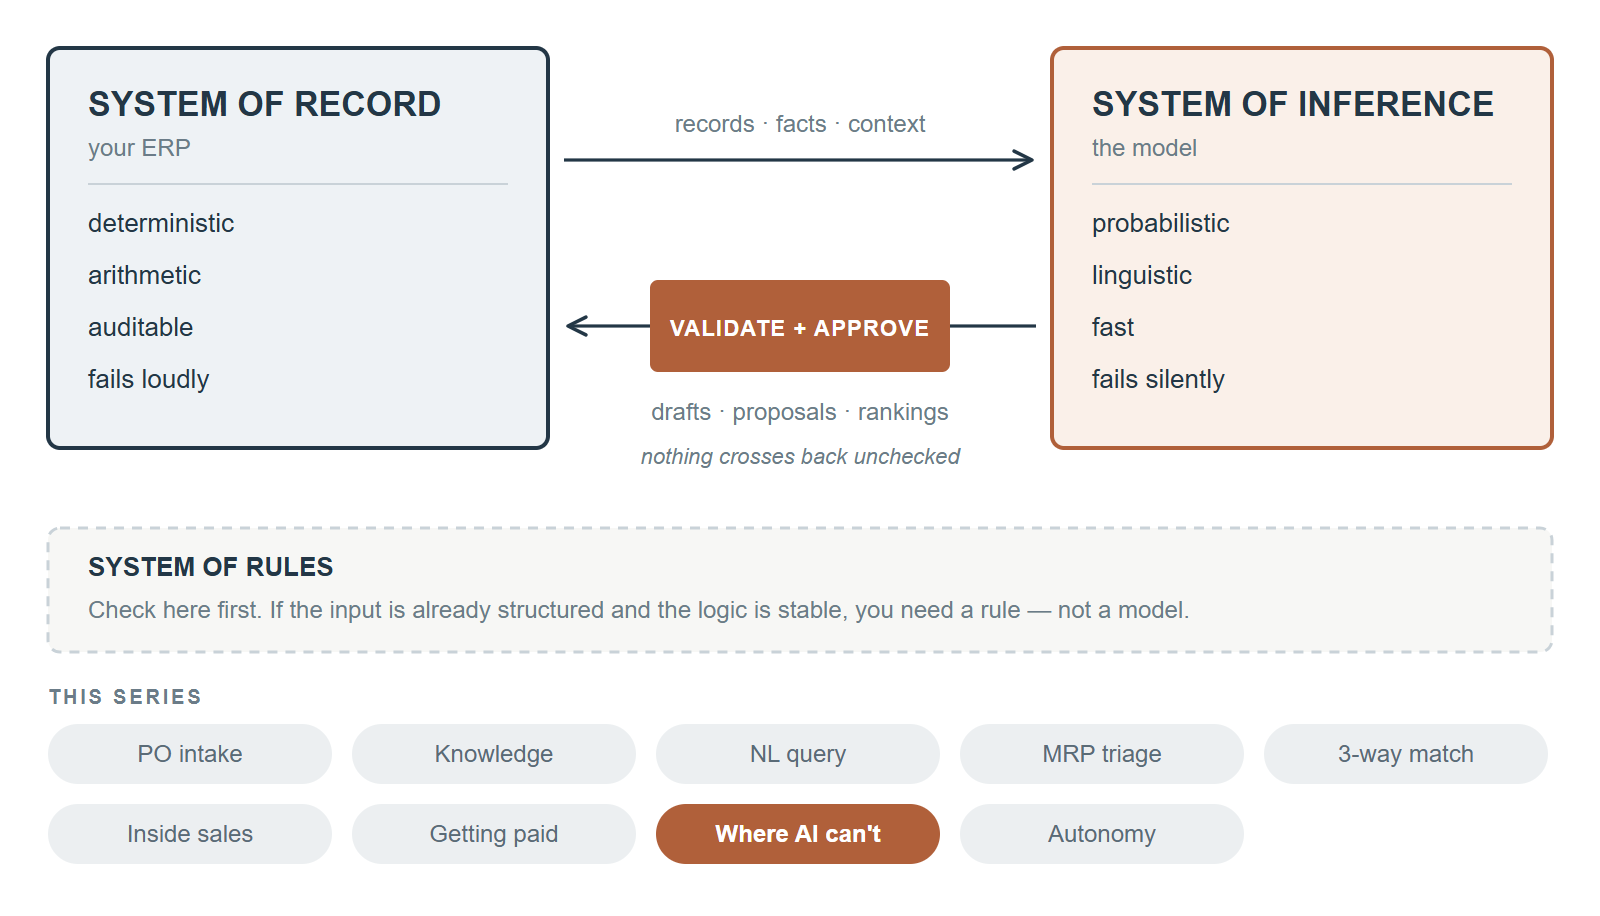
Every other post in this series puts the model on messy, linguistic input – a PDF, a ticket, a question about why – and that is where it earns its keep. This post is the mirror image: it draws the line on the outside, and explains why the forecast sits beyond it.
Start with the shape of the revenue, because it settles most of the argument. Spiese is 80% build-to-order manufactured revenue – roughly 8,200 engineered orders a year, part of 45,971 total – and 20% distributed from a 12,000-SKU stocked catalog. For that 80%, you do not forecast demand. You have something far better than a forecast: actual orders and a backlog. The customer has already told you what they want and signed for it. Pointing a predictive model at demand you can simply read off the order book is forecasting noise – dressing a known quantity up as an estimate and making it less certain in the process.
That leaves the 20% – the distributed parts, the 12,000 SKUs – as the only real forecast candidates. And here is the second turn: most of those SKUs have lumpy, intermittent demand. A part sells nine units one month, zero for the next four, then thirteen. There is no smooth curve underneath for a clever model to learn. Feed that history to a flashy machine-learning forecaster and it does what flexible models do with sparse, spiky data: it overfits – it learns the noise, mistakes last quarter's accident for a pattern, and predicts it forward with confidence. A dull classical method – a reorder point, a two-bin kanban, a safety-stock calculation, an intermittent-demand method of the Croston family built for exactly this spiky shape – does worse on paper at fitting the past and better in the warehouse at not stocking out. Cheaper, auditable, good enough. Boring wins.
Underneath both is the oldest reason of all, the one Post 4 named for a different feature: a forecast is a number. It has to add up, feed a purchase order, and survive an audit. Numbers are the one output you never ask a language model for – but the point here is broader than LLMs. Even a purpose-built ML forecaster is being asked to do statistics and operations research, a field with a hundred years of theory and tools, under a marketing label that implies novelty it doesn't have. The question was never "which AI?" It was "is this an AI problem at all?" – and mostly, it isn't.
The order book answers the 80%. Statistics answers the 20%. AI answers neither.
What actually does the job – and why it isn't AI
Does: for the manufactured 80%, the system of record already holds the answer – open orders, the backlog, confirmed ship dates. Planning reads demand; it does not predict it. For the distributed 20%, a classical inventory policy does the work: a reorder point per SKU, a safety-stock buffer sized to the demand variability and the supplier's lead time, and – for the genuinely intermittent parts – an intermittent-demand method designed for spiky histories. And where a part is consumed regularly enough to size a bin, there is an even lower-effort version of the same idea: a two-bin kanban, which is nothing but a reorder point made physical. You size two bins to cover demand over the lead time; when the first runs empty, that emptiness is the reorder signal – no nightly run, no message to read, no forecast at all, just two numbers on a card. It is the least-work numeric control there is, and for a shelf full of steady movers it beats anything a model would do. All of it is arithmetic you can write on a whiteboard, recompute by hand, and explain to a buyer. Marie, who has managed the parts catalog for years, already runs a version of this; the honest project is to tighten it – review the reorder points, refresh the lead times, segment the 12,000 SKUs by volume and variability – not to replace it with a model.
The temptation to reach for AI anyway – and why not:
"But AI could find patterns a reorder point misses." On smooth, high-volume, seasonal demand, maybe – and Spiese has very little of that. On lumpy, intermittent parts, "finding patterns" is precisely the failure mode: the model finds patterns that aren't there. There is nothing for it to learn, so it learns the noise.
"But 94% accuracy." That figure is someone else's business, someone else's demand shape, and – as an illustrative benchmark, not a Spiese number – it tells you nothing about your intermittent SKUs. A single blended accuracy percentage across a 12,000-SKU catalog hides exactly the parts that hurt when they're wrong. (Supply your own accuracy measure, per demand segment, before you trust any headline number.)
"But we should forecast the whole business." You already know the 80%. Forecasting it is not insight; it is converting a certainty into an estimate and calling it modern.
"But it's the future." For messy language, yes – that is the other nine posts. For a purchase-order quantity that has to be exactly right and defensible, the future looks a lot like a well-maintained safety-stock formula, and always has.
The refrain, because it is the whole post: a forecast is arithmetic and statistics. That belongs to a model that does math – not a model that does language.
The plumbing
A sane setup here is striking mostly for how little of it is AI.
Segment the 12,000 SKUs first – by annual volume and by demand variability – because a catalog that size is not one problem, it is four or five. The fast, steady movers take ordinary reorder points and economic order quantities – or, better still, a two-bin kanban, the reorder point made physical and the least work of all: the empty bin is the trigger, with nothing to compute and nothing to run. The slow, lumpy, intermittent parts take an intermittent-demand method sized to their spikiness. A long tail of near-dead SKUs takes a stocking decision, not a forecast, and some of it should probably be made-to-order or dropped. None of that needs a GPU. It needs the demand history the ERP already holds and a buyer who knows the suppliers.
The manufactured side needs no forecasting layer at all. It needs the backlog and the order book surfaced cleanly for planning – which the system of record already does, and which Post 5's MRP work already leans on.
Where does an inference layer legitimately touch any of this? At the edges, on the language, never on the number. Reading a supplier's emailed lead-time change out of a PDF so the reorder point can be updated – a messy-language task, a fair use of a model, feeding a human who commits the change. Explaining why a given SKU's safety stock is set where it is – the Post 3 pattern. But the reorder point, the order quantity, the safety-stock number: those are computed, checked, and auditable, and the model never writes them.
(Either way, the arithmetic is the platform's own – computed, checked, auditable – not a model's.)
Failure modes and guardrails
These are the failure modes of doing it wrong – of buying the AI forecaster anyway – and how a shop avoids them.
Overfitting sold as sophistication. The flexible model fits the past beautifully and predicts the future badly, and the sales deck shows you the fit, not the prediction. Guardrail: judge any method on a held-out backtest – hide the last several months, forecast them, compare to what actually happened – and judge it per segment, so the intermittent SKUs can't hide behind the steady ones.
The single headline accuracy number. One blended percentage across 12,000 SKUs is designed to look good and to conceal the lumpy tail where stockouts live. Guardrail: refuse to accept an accuracy claim that isn't broken out by demand segment, and measure the thing you actually care about – fill rate and stockouts on the parts that matter – not curve-fit.
Beating the wrong baseline. "Better than nothing" is not the bar. Guardrail: the baseline to beat is your current reorder points, properly maintained. Tune the boring method first, then ask whether anything fancier clears it. Usually the tuning was the whole win.
Forecasting the 80% you already know. Guardrail: scope the project to the distributed catalog only, and say out loud in the kick-off that the manufactured demand is read from the backlog, not predicted.
Auto-commit with no human. A forecasting tool that writes purchase quantities straight into the record with no buyer in the loop is the same error this whole series warns against, now attached to money and inventory. Guardrail: the number is a proposal; the buyer commits; the record executes with its audit trail.
How you'd know it worked
The strangest success metric in the series: you spent nothing on a chatbot, and your fill rate held.
That's the real test. If a quarter of maintaining and tightening the reorder points holds service levels on the parts catalog as well as – or better than – the AI platform would have, at a fraction of the cost and with numbers you can audit, the boring tool won and you have the receipts. Concretely, watch three things, each against your own current baseline, not a vendor's benchmark:
Fill rate and stockouts on the SKUs that matter – measured per demand segment, so the lumpy tail is visible. (Your current fill rate is the number to beat; supply it.)
Inventory dollars against service level – the distribution stock runs roughly $3.2M of the ~$15.8M total; the win is holding or improving service while not letting that number drift up. Good forecasting frees cash; a bad tool quietly buys "safety" you didn't need.
What you did not spend – the licence, the implementation, and the attention that stayed on problems where AI actually pays. This is the only post whose headline result is a line item that never appears.
If all three hold with the dull method, the project you didn't do is the one that worked.
Monday morning
Before you sign anything, do the one exercise that settles the argument for your own shop: split your demand and count it.
Take a month of order lines and separate the made-to-order revenue from the stocked-catalog revenue. For the made-to-order share, write next to it: this is backlog, not a forecast. For the stocked share, pull the twelve-month history on those SKUs and look at the shape – how many are steady, how many are lumpy, how many barely move. You will almost certainly find what Ellen found in her head at 4:15: the forecastable slice is small, and most of it is spiky. That picture, drawn once from your own data, is worth more than any accuracy percentage a vendor can show you.
Then, instead of the platform, spend a week with your Marie and the reorder points. Refresh the lead times, resegment the catalog, fix the buffers on the parts that stocked out last year – and put the steady movers on a two-bin kanban so they stop needing attention at all. It is unglamorous, it is cheap, and it is very likely the whole improvement.
Put your AI budget where the language is messy. Leave the math to the machine that does math.
Spiese Fluid Power is fictional – a composite built from published industry benchmarks and anonymized operating ratios. Its full operating profile, with sources, is published separately.